
We still need to talk about (TTFB) Time to First Byte...
I'm just going to say it, a faster TTFB does not mean a faster page load speed.
The myth of TTFB as a metric for site performance has been around since the early days of the web. There was even a time in those early days when it kind of mattered.
All the way back in 2012, John Cumming of Cloudflare wrote an absolutely excellent article entitled Stop worrying about Time to First Byte (TTFB) where he details why it's not as useful a metric as many would think...
The TTFB being reported is not the time of the first data byte of the page, but the first byte of the HTTP response. These are very different things because the response headers can be generated very quickly, but it's the data that will affect the most important metric of all: how fast the user gets to see the page.
Stop worrying about Time To First Byte (TTFB) | Cloudflare
To best illustrate the point, he documented a test he performed on a Wikipedia page with GZip compression enabled and then again with it disabled. The Time to First Byte for the page was 8 times slower with GZip enabled but it downloaded to the end user 5 times faster.
...that's because nginx waits until compression has started before sending the HTTP headers; when compression is turned off it sends the headers straight away. So if you look at TTFB it looks as if compression is a bad idea. But it you look at the download time you see the opposite.
Stop worrying about Time To First Byte (TTFB) | Cloudflare
This is just one example of TTFB not only being a useless metric, but actually a misleading one. If you're sitting a room with a basic server, and a computer wired to it, TTFB matters. Your browser sends a request for a page and some headers. The server then responds with a 200 status (all going-well), then more headers and after that... the page content. In that scenario, if you had a high TTFB there'd be something very wrong.
When it comes to hosting providers, especially ones with GZip, caching layers, etc... TTFB is a worse than useless metric.
I ran my own tests, curling a hosted website from my own machine.
Here's a breakdown of the TTFB:
** FIRST HIT (uncached) **

DNS Lookup:  0.005184
Initial connect:  0.262817
Connect time:  0.822863
Pretransfer:  0.824668 (processing PHP)
Start transfer:  1.057677
Total:  2.559113

** SECOND HIT (cached) **

DNS Lookup:  0.005178
Initial connect:  0.215978
Connect time:  0.597476
Pretransfer:  0.597743
Start transfer:  0.855089
Total:  1.071372
Here's the equivalent reported by my browser (using a fantastic Chrome extension called Performance-Analyzer.):
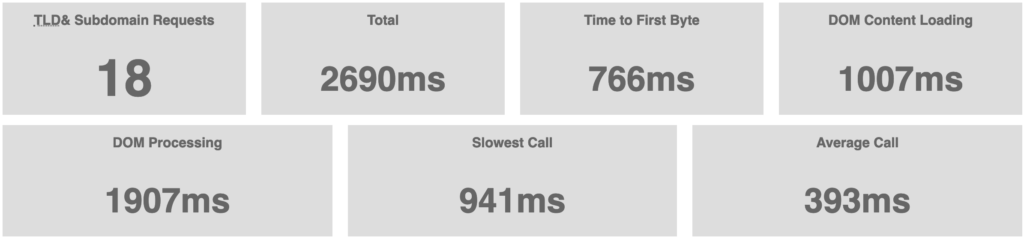
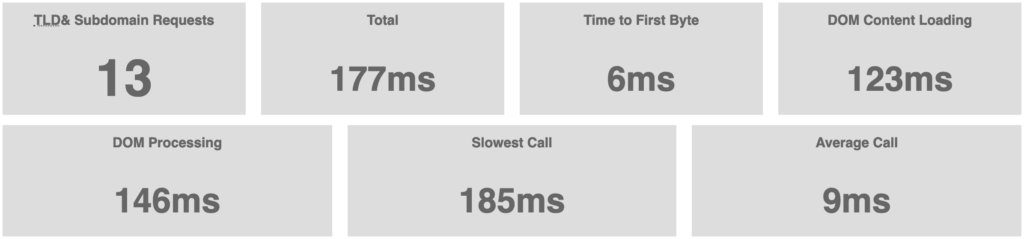
For an uncached first request, you can see the TTFB reported as 766 milliseconds which roughly matches the curl connect time above. The second hit is 6 milliseconds because all the processing is done and cached.
So I had an idea. I made a plain .HTML file and popped on the site to see what this request TTFB would be without all that PHP being processed:
<!DOCTYPE HTML PUBLIC "-//W3C//DTD HTML 4.01 Transitional//EN" "https://www.w3.org/TR/html4/loose.dtd"> <html lang="en"> <head> <meta http-equiv="content-type" content="text/html; charset=utf-8"> <title>TTFB Test</title> </head> <body> <p>How fast am I tho?</p> </body> </html>And this was the result:
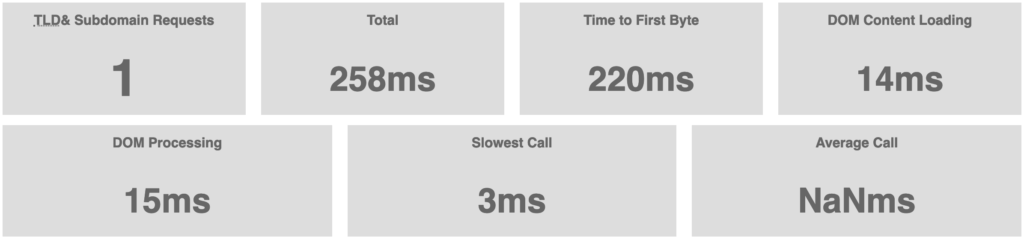
From 776 milliseconds TTFB to 220 milliseconds TTFB on the exact same site and server. The difference is that the first request included processing all of the /blog page PHP (Apache) and the second didn't.
This should illustrate the variance in TTFB results based on what PHP is being processed. On top of this, if you measure the TTFB remotely you're also measuring the network latency all the way to the server and back, you'll get different results based on your network provider, your location, etc.
You may indeed be measuring a whole bunch of things - but - you are specifically not measuring the speed at which the server is actually first responding to a request.
Just for fun, let me throw another spanner in works. Here's another request to the exact same /blog I measured while playing around with some caching settings:
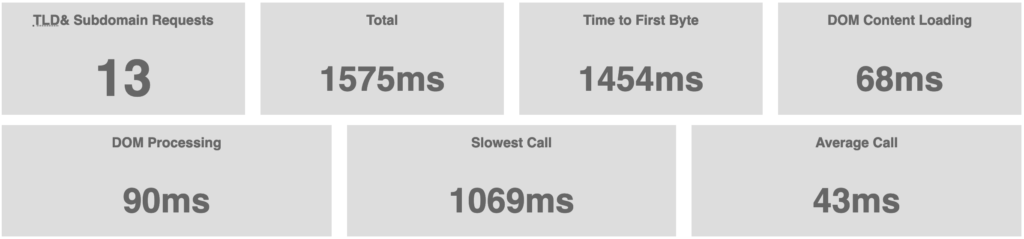
From this result you can see that the TTFB is basically identical to the total page load time. This is because the response header was sent towards the end of the almost all the processing. Almost everything is done by the time the first header hits browser.
Ultimately, you could send unprocessed data as early as possible to the requesters' browser and score a low TTFB, but the user's actual experience will be far slower.
Or you can look at doing it the right way - optimizing and reducing the amount of PHP that needs to be processed on the server (and employing the use of GZip etc.) before being served.
For WordPress users, TTFB is mostly made up of the amount of time it takes for your PHP to process (ie. your theme and plugins). Notably, plugins like Autoptimize, WP-Rocket and Fast Velocity Minify will contribute to a significantly higher TTFB, even though they're optimizing overall page load time.
There are of course times when TTFB is a useful datapoint as part of a set of metrics to build context around identifying a problem. But its use is limited to being a comparative figure. For example, if you have two identical and static instances of a site on separate servers - all things being equal - TTFB can be useful to metric to zoom in on performance issues. Also, if you snapshot TTFB on a regular basis and have a sample of consistent results, you can monitor for deviations from that baseline.
But these scenarios are almost never applicable to overall web page performance. If you're optimizing your site the right way your TTFB may increase, but your site will be faster.